
![Asia Business Centre (Asia Business Centre (AsiaBC) [HK+SG Bank Account Opening / Company Formation / Company Secretary / Accounting & Tax])](https://asiabc.co/wp-content/uploads/Blog-Banner-4-Steps-to-Deploy-Business-Data.png)
4 Steps to Deploy Business Data in a Logical Environment
Structure you business data in a relational environment
Even if your business is using heavily on spreadsheets as the tools of information management, a proper and efficient method to place your data in a logical environment could boost your business in the aspect of following:
- Time Saving: Retrieve the store data by your partners or employees in a effective manner; your new staff can pick up the operation in fast pace.
- Insight: Spot the “missing link” in your operations in which may be the bottleneck, duplicated input, and tedious work.
- Work-flow: Formalize the processes in operation with data updates and input.
- Expansion: Provide a ground for data to grow with your business expansion.
To deal with the question “how to arrange my business data to be relational?“, we need a effective tool.
Entity-Relationship Diagram is the tool
Its name explained that Entity-Relationship Diagram (ER Diagram) tries to link “Entities” by “Relationship” which we can see or feel in a situation, here are the common examples:
| Entity A | Entity B | Relationship |
|---|---|---|
| SCHOOL | STUDENT | Beloinging |
| COMPANY | PRODUCT | Selling |
From the above example, each entity is a group of similar things, and a entity is somehow be related with the other entity in a system. On the other hand, we tend to group a set of things in a entity because all these things share some common characteristics. For simple understanding, we name the characteristics as “Attributes“.
Following up the above example, we can easily think of the attributes of a entity as follows:
| Entity | Entity’s Attribute(s) |
|---|---|
| SCHOOL | name of school, address of school, total no of students |
| STUDENT | name of a student, birthday of student, gender of student, a school that this student belongs to |
You may feel confused that who bothered to break down the things into Entities, Attributes, and Relationship when we can simply show the relationship of belonging between a single table, example is as follows:
| Name of Student | Name of school which the student belongs to. |
|---|---|
| Tim | ABC Primary School |
| Mary | JKL Secondary School |
Evey row is a “Record” of a relationship between one school and one student, now every record consists of 3 “Values“, it is easy to read and follow.However, this simple table as above just cannot help when growth of data size and complexity kick in.
Imagine that when we need to include the particular details of schools and students into the above table, it can expand this table to be over 20-column in width. Nevertheless, if a value in the table is not static and related to the other pieces of information e.g. the total number of students of a school requires the counting of number of row that has the name of a particular school, workload of updating the table is huge.
As improvement, we simply split the table of students belonging to schools into 3 tables as follows:
| Student ID (Unique) | Name | Gender (Male or Female) | Date of Birth (YYYY/MM/DD) |
|---|---|---|---|
| T001 | Tim | Male | 1999/11/25 |
| T002 | Mary | Female | 2001/9/12 |
| School ID (Unique) | Name | Address | No. of classrooms |
|---|---|---|---|
| S001 | ABC Primary School | 123 Education Road, Kowloon, Hong Kong | 30 |
| S002 | JKL Secondary School | 18 Wisdom Street, Fortress Hill, Hong Kong | 48 |
| Student ID | School ID | Date of enrollment (YYYY/MM/DD) | Date of leaving (YYYY/MM/DD) |
|---|---|---|---|
| T001 | S001 | 2005/07/14 | 2011/06/30 |
| T002 | S002 | 2013/10/20 |
Remark(s):
- An attribute “Student ID” is created for every student because it is possible that 2 students have the same name and same date of birth. We need an unique attribute of every record (i.e. row) of a student for correctly related.
- An attribute “School ID” is created for every school because of neat information storage in the table of relationship.
- The column “Date of enrollment” and “Date of leaving” are now possible to be included in the table of relationship for the calculation of total no of students belonging to a school in any period of time.
- Restriction on input of values is a useful tool to maintain the integrity of data.
Simply put, effective grouping of the every entities and drawing out their relationship in a business operation means structuring your data in a logic manner. To represent the concept clearly, ER diagram is the right tool.
How to create ER Diagram in 4 steps (with example)?
After we have grabbed the general understanding of “Entity” and “Relationship“, we can follow 4-step approach to create a ER Diagram in an effective way:
- Information gathering: Understand the business processes and rules
- Extraction of the entities and their attributes: Figure out the things and their associated information that take place in those processes
- Assessment of the dawn entities: Simplify the drawn entities, add the missed entities, add the attributes of each entity
- Built-up Association between entities: Figure out possible relationships between entities by linking them together
Working Example : Front-end operation of an online retails shop
Step 1: Information gathering
The operation of purchase products by customers involves the processes as follows:
- Customers place products into their shopping carts
- A customer chooses a delivery method for item(s) in a shopping cart on the checkout
- A customer inputs personal information on the checkout
- A customer chooses a payment method on the checkout
- A customer chooses a delivery address
- A customer chooses a preferred delivery days
We can further expand the details in above processes:
- Customers can place many products in the shopping carts, delete, add merchandise, and modify the quantity.
- Available delivery methods are pick-up at store, home delivery, and etc.
- Membership registration requires basic personal information from customers.
- Available payment methods are credit card, bank transfer, and etc.
- Customers can choose the primary address, or specify other locations.
- Customers can specify the delivery date and specific time range.
Step 2: Extraction of the entities and their attributes
We can try write down the entities and their attributes generated in each of the above process:
- PRODUCT entity: Product ID, Product Name, Price, Discount
- DELIVERY entity: Delivery ID, Delivery Method
- CUSTOMER entity: Customer ID, Customer Name, Customer Address, Customer Phone Number
- PAYMENT entity: Payment ID, Payment Method
- SHIPMENT entity: Shipment ID, Shipment Address
- SHIPMENT TIME entity: Shipment Time Range, Business Day, Working Hour
Step 3: Assessment of the dawn entities:
We have created 6 entities, and then we should classify them into 2 groups based on their characteristics:
- Event entities
Situations that happen in a specific time
i.e. DELIVERY, PAYMENT, SHIPMENT ADDRESS, SHIPMENT TIME - Resource entities
Static information that are fixed with entities
i.e. PRODUCT, CUSTOMER
From the above grouped entities, we are still difficult to link all resources and events together. Why? Let’s review the business processes and incorporate the event entities and resources entities:
- A customer can make multiple event of purchases in different time.
- A event of purchase and involve only a customers.
- An event of purchase can involve multiple products.
- Quantity of a product in an event of purchase can be more than 1.
- An event of purchase can result in an event of delivery which should involve 1 delivery method, if pick-up is selected, it should involves 1 shipment time; if home delivery is selected, it should involve 1 shipment time, 1 shipment address.
- In an event of shipment as home delivery, the shipment address can be either the same to customer address or a new address.
- In an event of shipment as home delivery, the shipment time range cannot be freely chosen by the customer since the time is depending on the seller’s business day and working hour
The major problem is that we cannot links resource PRODUCT with CUSTOMER, and the following event of DELIVERY, PAYMENT, SHIPMENT ADDRESS and SHIPMENT TIME. The workaround is to create 2 new entities ORDER and ORDER ITEM.
An improvement should be done by separating the SHIPMENT TIME into BUSINESS-DAYS and SHIPMENT since we cannot find relationship between the attribute of Shipment Time Range, Business Day, Working Hour.
One more concern is untouched. Since we do have indication from the step 1 that a record of ORDER can consist of duplicated record of PRODUCT or not, it is better to assume that it should be able to do so. In real life situation, discount may be included under some circumstance that involve the same record of PRODUCT being involved in the same record of ORDER.
Here is revised table of business processes, related entities and their attributes in the operation of purchase by customers:
| Step # | Business Process | Entity | Type | Attributes |
|---|---|---|---|---|
| 1 | Products are placed into shopping carts | PRODUCT | Resource | productID productNAME productPRICE productDISCOUNT |
| 2 | Delivery methods are selected | DELIVERY | Event | deliveryID deliveryMETHOD |
| 3 | Customers check the details of their order | CUSTOMER | Resource | customerID customerNAME customerADDRESS customerPHONENO |
| 4 | Payment methods are selected | PAYMENT | Event | paymentID paymentMETHOD |
| 5 | A shipment time is selected by customers | SHIPMENT | Event | shipmentID shipmentTIMESLOT |
| 6 | Available shipment date and time slot | BUSINESS-DAYS | Resource | businessDATE businessHOUR |
| 7 | Purchase orders are created | ORDER | Event | orderID orderDATE totalAMOUNT |
| 8 | Details of a purchase order | ORDER-DETAIL | Event | orderdetailID productID productQUANTITY suttotalAMOUNT |
Step 4: Built-up Association between entities:
If you do not have any diagram drawing software on hand, we suggest draw.io as a free-of-charge web service.
This step is the most important part, we need to link the entities with relationship now.
First of all, we have to select or create at least one attribute of an entities as a “Primary Key” which is able to uniquely represent a record (i.e. a row) of an entity.
Secondly, we need to think about the direct relationship between 2 entities in which this may fall into either one of the following:
- One-to-One (Any one entity of type XX can contain at most one entity of type YY, vice versa.)
- One-to-Many (Any one entity of type XX can contain many entity of type YY. Any one entity of type YY can contain at most one entity of type XX.)
- Many-to-Many (Any one entity of type XX can contain many entity of type YY. Any one entity of type YY can contain many entity of type XX.)
Below is a part of the ER Diagram between 2 entities ORDER and ORDER-DETAIL, we usually use rectangle shape to represent entity and diamond shape to represent relationship:
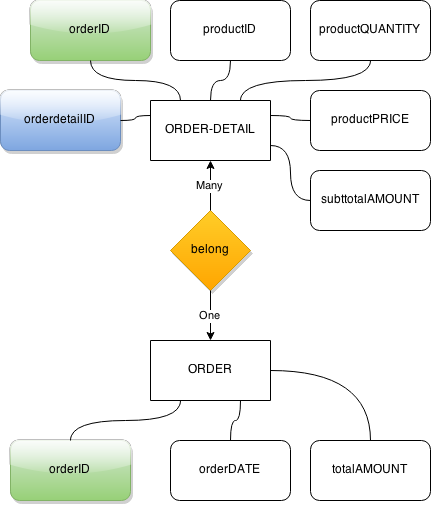
A new attribute “orderdetailID” as Primary Key of ORDER-DETAIL is created to uniquely represent every record of this entity since duplicated productID is allowed in a record of ORDER. In case that duplicated productID in every record in ORDER-DETAIL is NOT allowed, we may simply omit attribute orderdetailID and select productID as the primaryID and orderID as Primary Key of entity ORDER-DETAIL.
Relationship between ORDER and ORDER-DETAIL are linked by a attribute named “orderID”, so we should select “orderID” as a Primary Key of ORDER.
Every record of ORDER should belong to one or many records of ORDER-DETAIL while every record of ORDER-DETAIL should belong to only one and only one record of ORDER, we find out that the direct relationship between ORDER and ORDER-DETAIL entities are one-to-many.
Do you notice the present of attribute “productID” in entity ORDER-DETAIL? its role is the link to the 3rd entity, we name this kind of entity as Foreign Key.
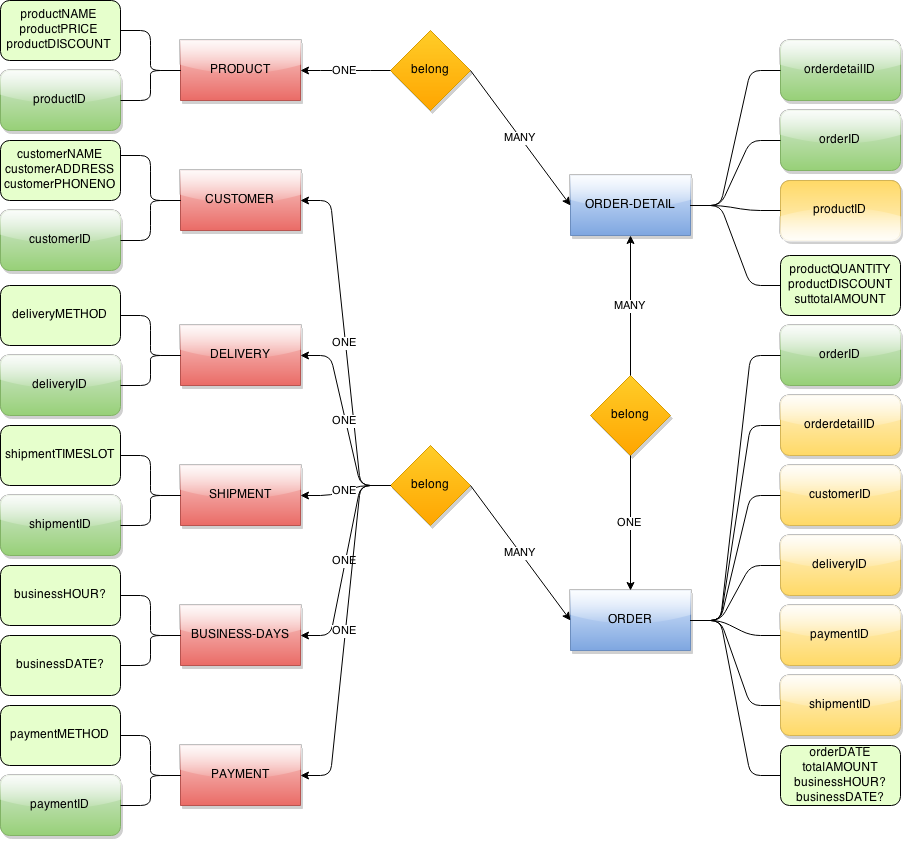
We repeat the process of identifying Primary Key, Foreign Key, direct relationship between 2 entities, finally, we can obtain the entire ER diagram of the example as follows:
Conclusion
We hope that every start-up business owner should spend an afternoon to think about how their business data are stored, and create a ER Diagram to discover any potential improvement in their work-flow. We believe that after constructing a ER diagram, it can also help the process of data manager even you are using spreadsheet software as a database, although a relational database can offer extra benefit that cannot be matched by spreadsheet.

![Asia Business Centre (Asia Business Centre (AsiaBC) [HK+SG Bank Account Opening / Company Formation / Company Secretary / Accounting & Tax])](data:image/svg+xml;nitro-empty-id=ODcwOjExNjE=-1;base64,PHN2ZyB2aWV3Qm94PSIwIDAgODAgODAiIHdpZHRoPSI4MCIgaGVpZ2h0PSI4MCIgeG1sbnM9Imh0dHA6Ly93d3cudzMub3JnLzIwMDAvc3ZnIj48L3N2Zz4=)
![Asia Business Centre (Asia Business Centre (AsiaBC) [HK+SG Bank Account Opening / Company Formation / Company Secretary / Accounting & Tax])](data:image/svg+xml;nitro-empty-id=ODcwOjIyOTQ=-1;base64,PHN2ZyB2aWV3Qm94PSIwIDAgODAgODAiIHdpZHRoPSI4MCIgaGVpZ2h0PSI4MCIgeG1sbnM9Imh0dHA6Ly93d3cudzMub3JnLzIwMDAvc3ZnIj48L3N2Zz4=)


